What 42 million museum visitors taught us about digital engagement in 2025
We analysed 42 million visitors to understand what's working – from the best audio length to AI adoption. Here are five insights to shape how you think about visitor guides.

Martin Jefferies
Head of Marketing and CRM
5 min read
•

Last year, Smartify users spent 260,000 hours engaging with audio content – that’s a 50% increase on 2024.
But while those numbers are eye-opening, they don’t tell the full story.
Look deeper, and clues about how museums should be thinking about digital engagement start to emerge.
Drawing on usage among the 42 million people who visit the cultural institutions we partner with every year, we looked for patterns that should inform how museums approach audio guides, multilingual content and emerging technologies in 2026.
Here’s what we learned.
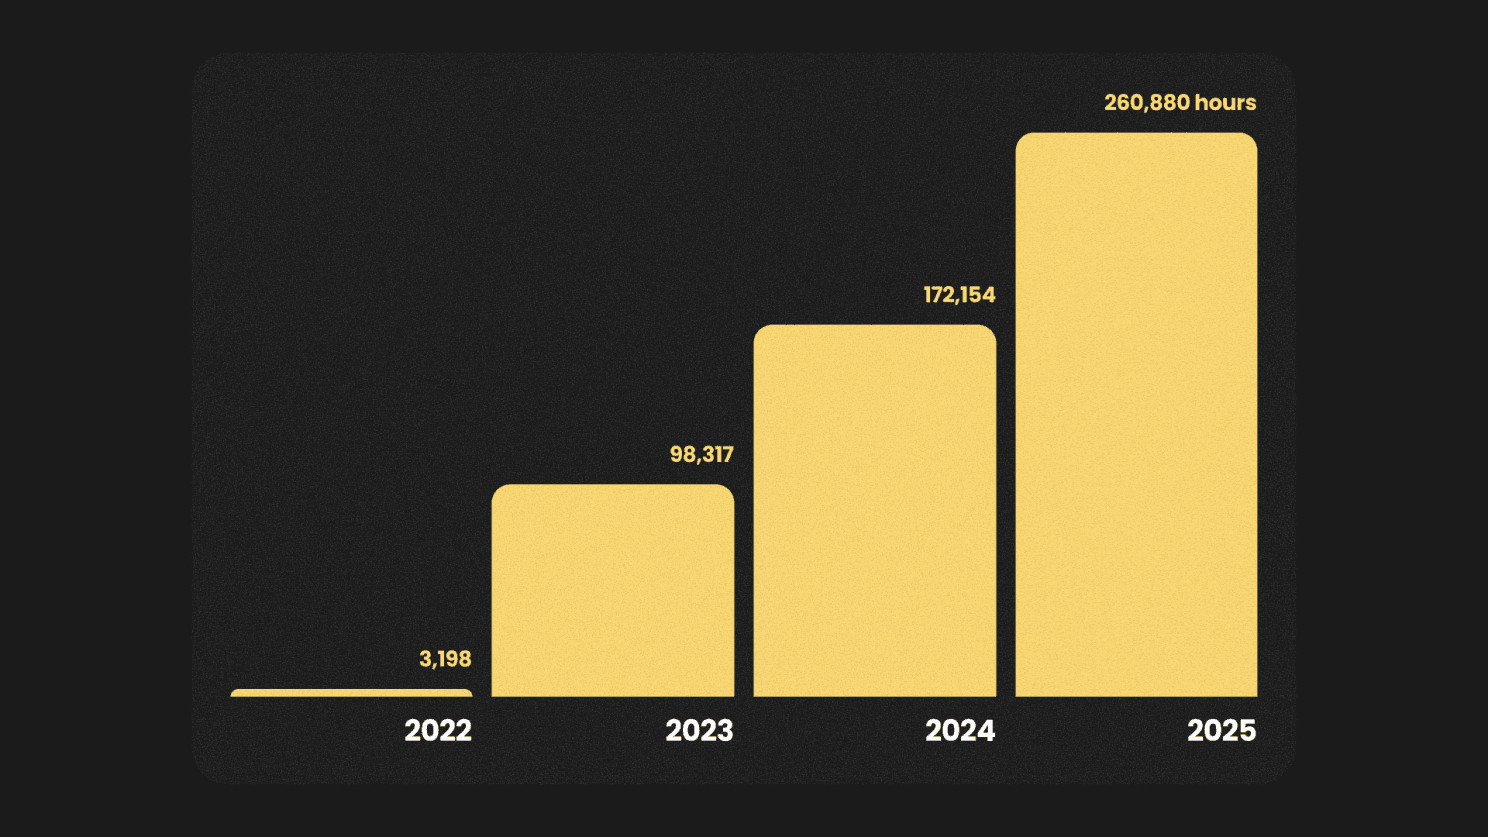
Number of hours of content consumed by Smartify users every year
1. People are listening for longer than ever before
Over the last year, people spent the equivalent of 10,870 days listening to audio tracks on Smartify. (That’s like watching Elf on repeat 161,000 times! 🍿)
Compared to the year before, consumption of audio guides increased by 50% across all our partners.
The fact that even long-established partners saw consumption increase by up to 425% this year proves that appetite for audio guides isn’t waning.
Interestingly, around half of all listens originated from venues’ custom web apps (CWAs). A new feature we rolled out in 2025, these branded visitor experiences are built on top of the Smartify platform and are ‘locked’ to a single organisation, keeping the focus firmly on that one collection.
The fact that even long-established partners saw consumption increase by up to 425% this year proves that appetite for audio guides isn’t waning.
Museums that invest now in strong digital experiences are riding a rising tide, rather than fighting an uphill battle.
➡️ Listen some of the year's most popular tours
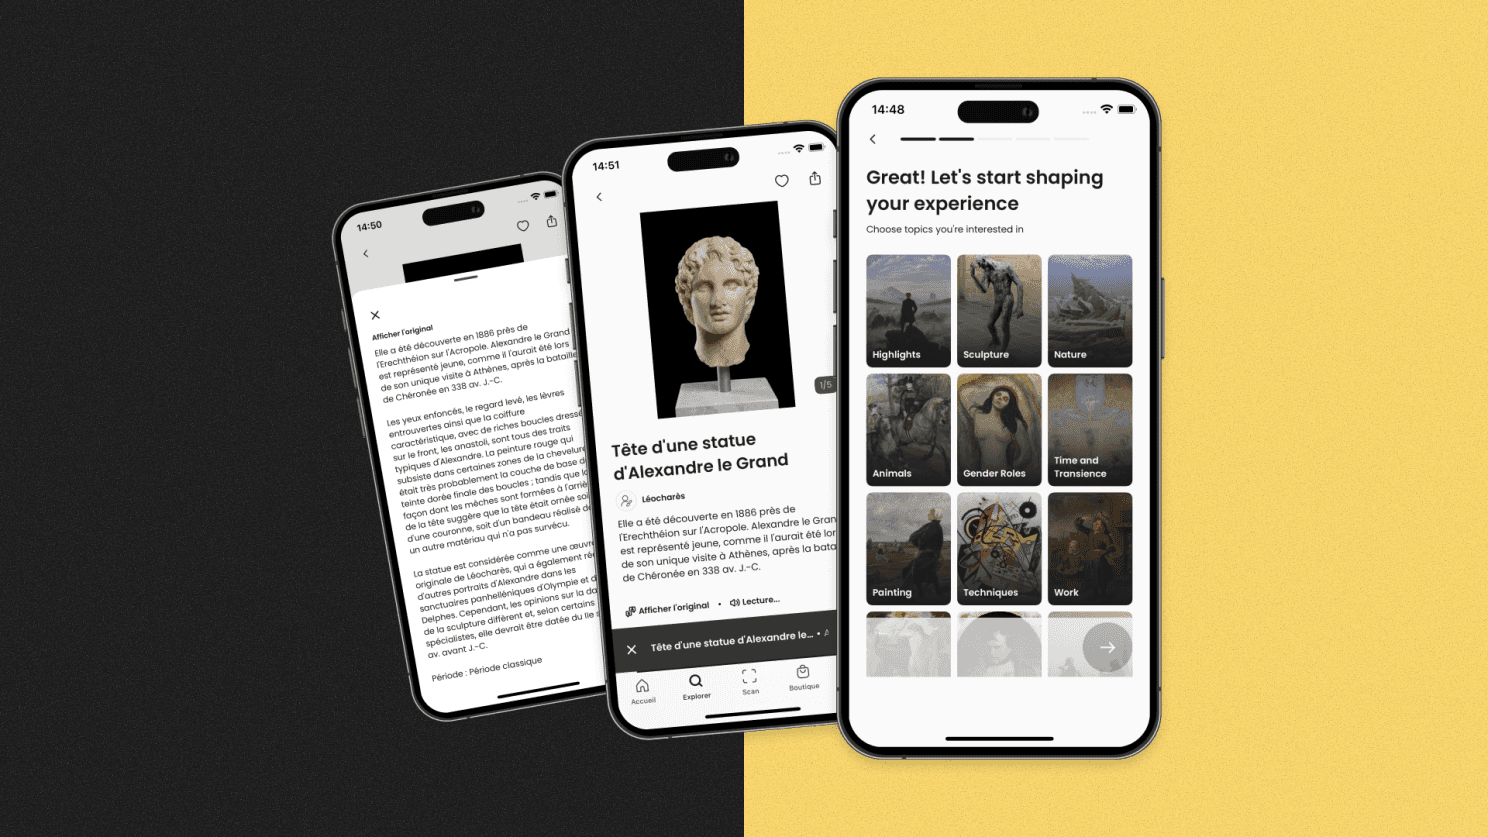
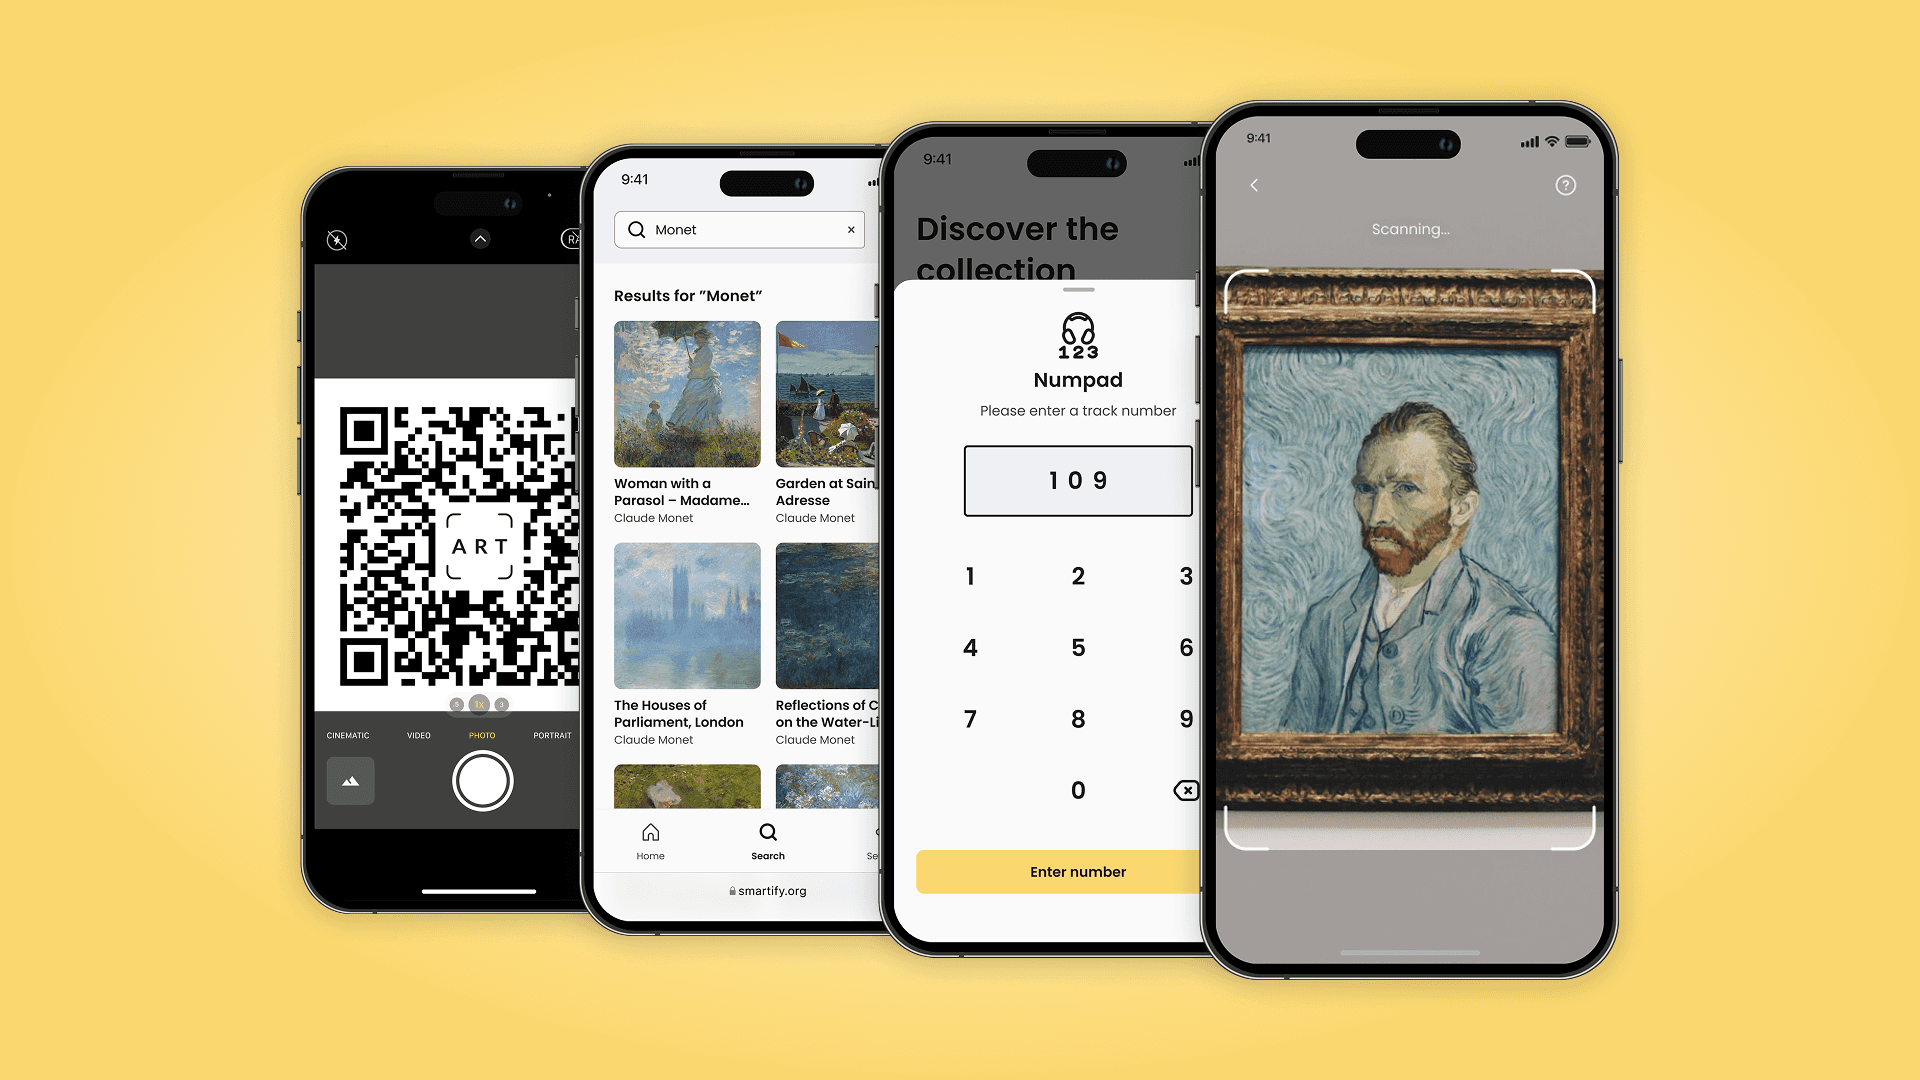
Smartify's AI features can help visitors create personalised tours, translate content and listen to text
2. There’s no getting away from AI
Artificial intelligence really hit the mainstream in 2025, and while it’s still early days for the sector, visitors to museums and art galleries don’t seem intimidated by using AI features to help them explore.
At venues who adopted our AI features first, 15% of users are already using tools like translations and text-to-speech. 🤖 We’ve provided 140,000 translations and 70,000 dictations so far, and we’re expecting to see this number increase significantly in 2026.
Personalisation – where visitors create their own bespoke itinerary to explore what interests them most, in whatever time they have available – proved equally compelling.
With a completion rate of 65% versus 52% for pre-built ’linear’ tours, there’s clear evidence that personalized experiences significantly boost engagement.
One of our partners – a national art collection with global significance – saw nearly 5,500 custom tours created in 2025: a level of personalisation that was unimaginable even a couple of years ago. With a completion rate of 65% versus 52% for pre-built ’linear’ tours, there’s clear evidence that personalized experiences significantly boost engagement.
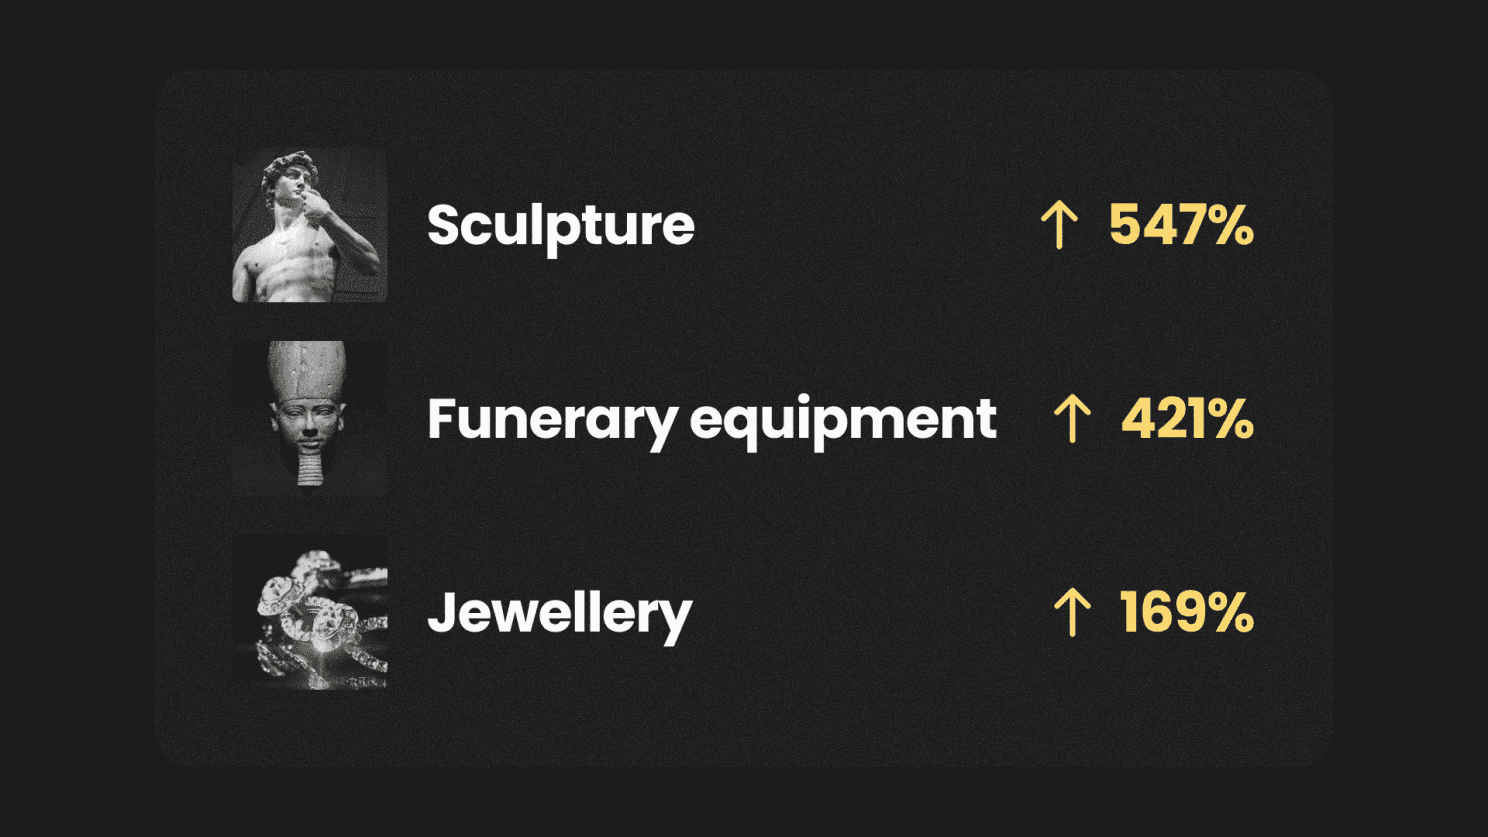
Some of the more niche art media that gained popularity in 2025
3. 2025: the year of the non-painting?
It’s true that paintings still account for the vast majority of object views on Smartify. (We looked at 1.2 million of them last year!)
But it’s interesting to see categories like statues (+548%), sculpture (+248% year-on-year) and monuments (+246%) enjoying some of the biggest year-on-year increases.
Even funerary equipment was up 187%! ⚰️
It just goes to show there’s an appetite for your collection, no matter what it contains.
Don't limit audio guides to your permanent collection highlights next year. Visitors want to see deeper dives into more niche, specialised objects alongside the ‘star’ attractions.
➡️ Explore all of our top 10s on the Smartify app
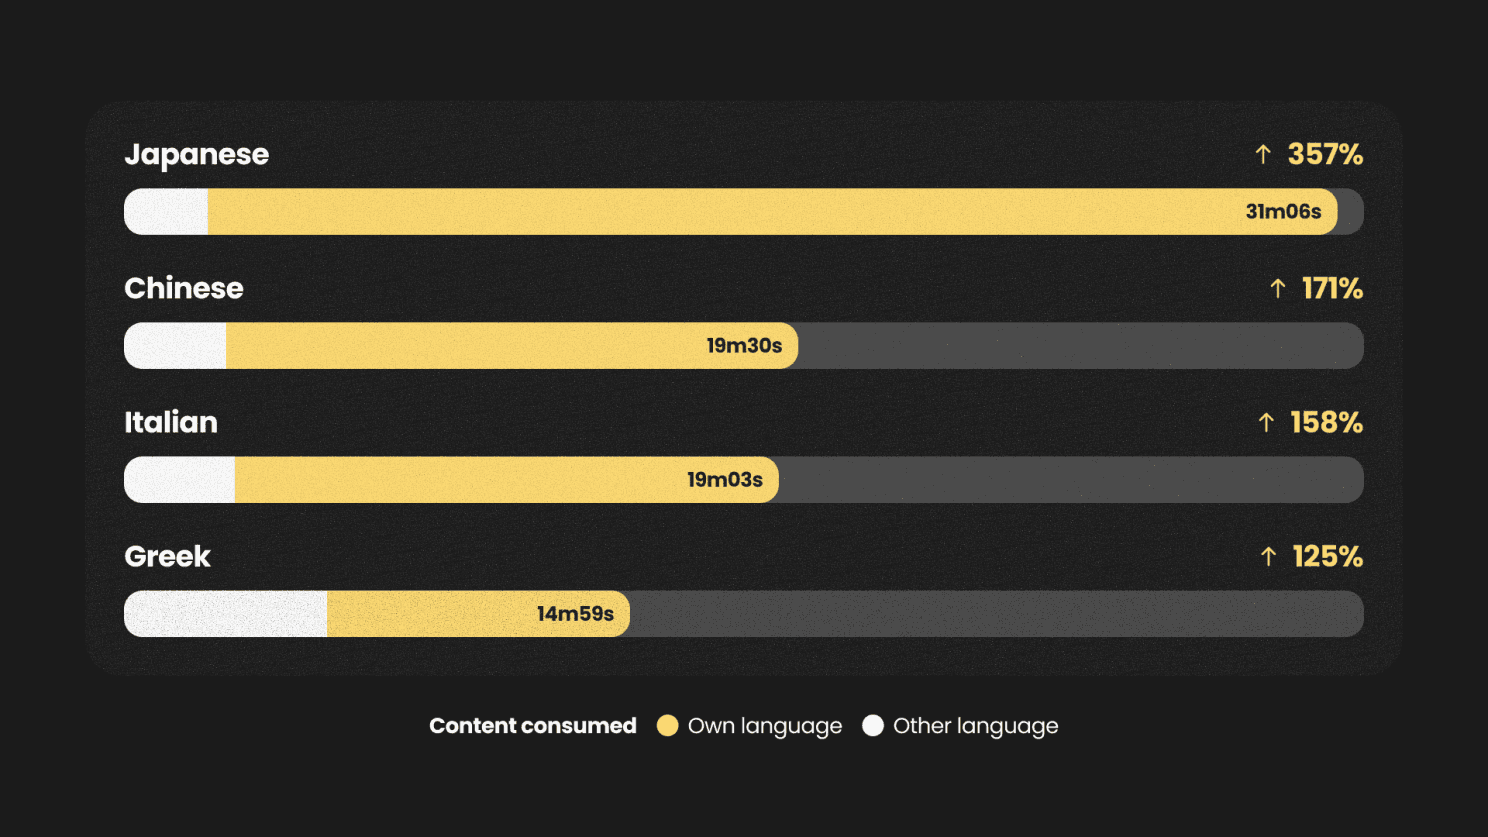
Average listen time for users in their own language compared to another language
4. It’s critical to meet your audience with content in their language
In 2025, Smartify made it easier to provide multilingual audio and text, with seamless language switching and AI-assisted translation and text-to-speech. Now visitors can not only read expert introductions in their own language – they can hear them, too.
Why’s that important? 🌎 Well, 2025 showed that, on average, users spend far longer listening to tours in their own language (around 17 minutes) than they do in a language that isn’t their native tongue (less than 11 minutes).
Japanese visitors spent, on average, 31 minutes listening to content in Japanese, compared to just 7 minutes in other languages.
It’s even more apparent for Greek (15m1s vs 6m41s), Italian (19m5s vs 7m23s) and French (15m53s vs 9m22s) speakers.
And Japanese visitors spent, on average, 31 minutes listening to content in Japanese, compared to just 7 minutes in other languages. That’s not just a preference; it’s a deal-breaker.
The key takeaway is that failing to provide multilingual options could mean losing 60% of potential listening time from international visitors. If your visitors are multilingual then your audio guide needs to be, too.
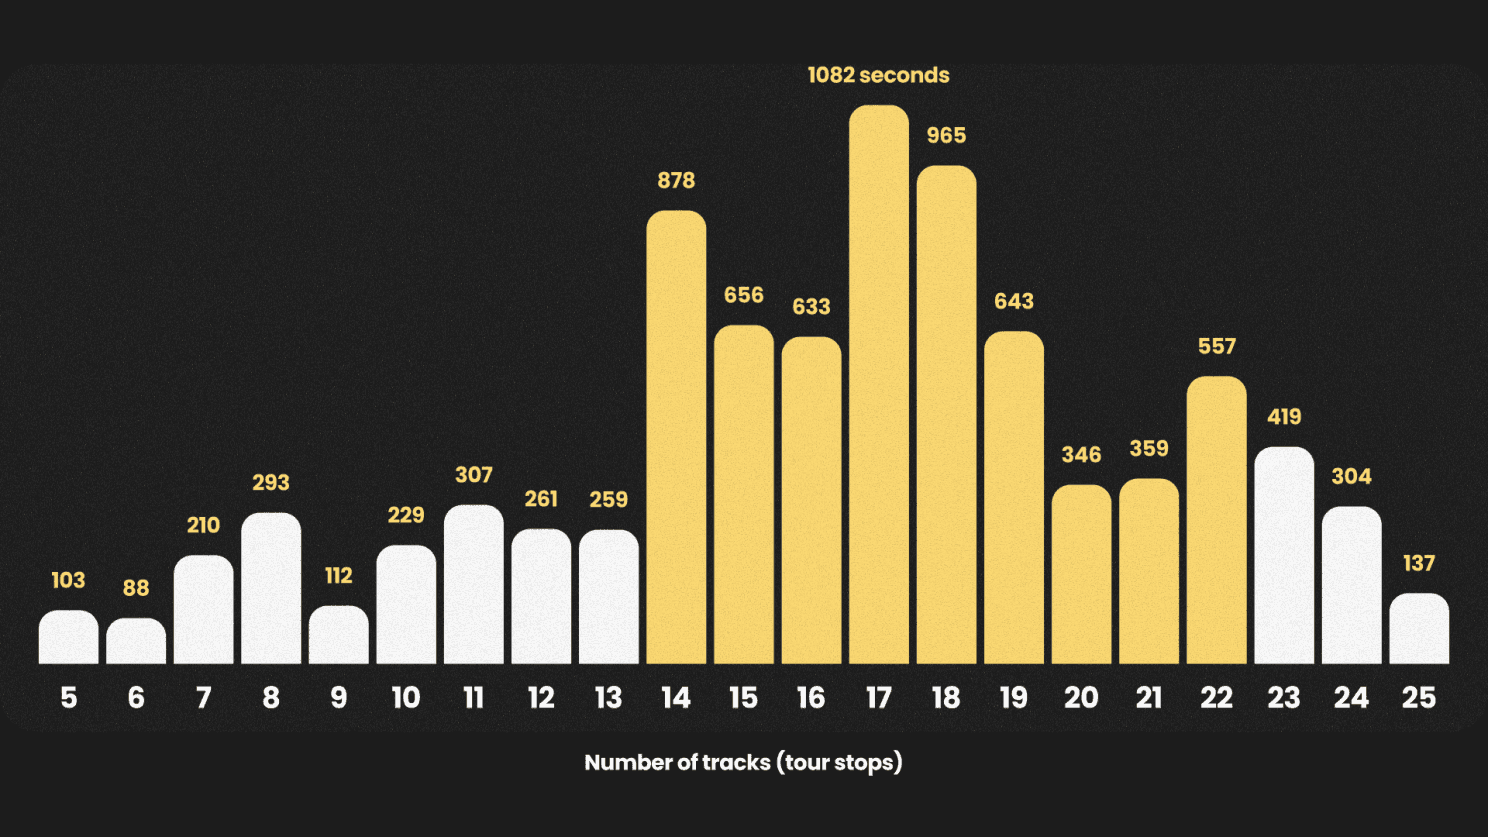
The average listen time (seconds) for a variety of tour lengths
5. The sweet spot for audio tours might be longer than you think
We regard anything between 20 and 40 minutes as a good average listen time – and in 2025, the most reliable way to achieve this sort of engagement was to publish 14-22 stops.
There‘s no magic formula and you can certainly go much longer. (We‘ve seen some 56-stop tours average 28 minutes and 69-stop tours hit 44 minutes!) But it’s rare to achieve our benchmark listen time with anything less.
So if you‘re budgeting for new audio guide content in 2026, you should plan for more, not fewer, stops to see meaningful engagement.
Conclusions: what we learned
These innovations have opened up a world of possibilities for cultural venues where uploading audio tracks in multiple languages might be impractical and expensive, or where wall labels can’t easily be added.
As we look toward 2026, three trends stand out:
visitors are engaging more deeply with digital content than ever before
multilingual access is increasingly non-negotiable
AI is moving from ‘experimental’ to ‘expected’ faster than most institutions anticipated
The museums seeing the strongest results aren’t necessarily the ones with the biggest budgets or the most famous collections. They’re the ones meeting visitors where they are, with accessible, engaging content that respects how people actually want to explore.
If you’re curious how your engagement metrics compare to these benchmarks, or you want to discuss what these insights mean for your institution’s digital strategy, we’d love to hear from you.
More stories

Bodleian Libraries launches new Outdoor Audio Trail with Smartify

Horniman Museum and Gardens launches playful AR trail with Smartify
How visitors discover more about your collection and why it matters

The future of cultural experience: five things we learned at Experience 2031

Connecting visitors to 800 years of history at Grimsthorpe Castle